
Happy New Year and welcome to the second instalment of my series taking the “long view of M&A”. As 2021 drew to a close and in 2022, I’m blogging at https://www.sterlingvdr.com/insights on a variety of M&A-related topics that have caught my attention, and trying to make sense of them in the context of my 27 years working as an M&A practitioner.
In part 1, I discussed the fact that target valuations are at 30-year highs, why M&A multiples have been chased upwards, and how strategic acquirors could respond to the increasing competition from private equity for deals. For this second part, I’ve taken a deeper dive into the data to show how private equity has taken advantage of the extraordinarily loose monetary policy of the past decade or more to close the valuation gap with strategic acquirors and in the process become the “new conglomerates”.
Let’s start by looking at a chart which compares acquisition multiples paid by private equity and strategic acquirors for the past 30 years.
Worldwide median target EV/EBITDA[1] multiples paid, 1992-2021, private equity vs. strategic acquiror
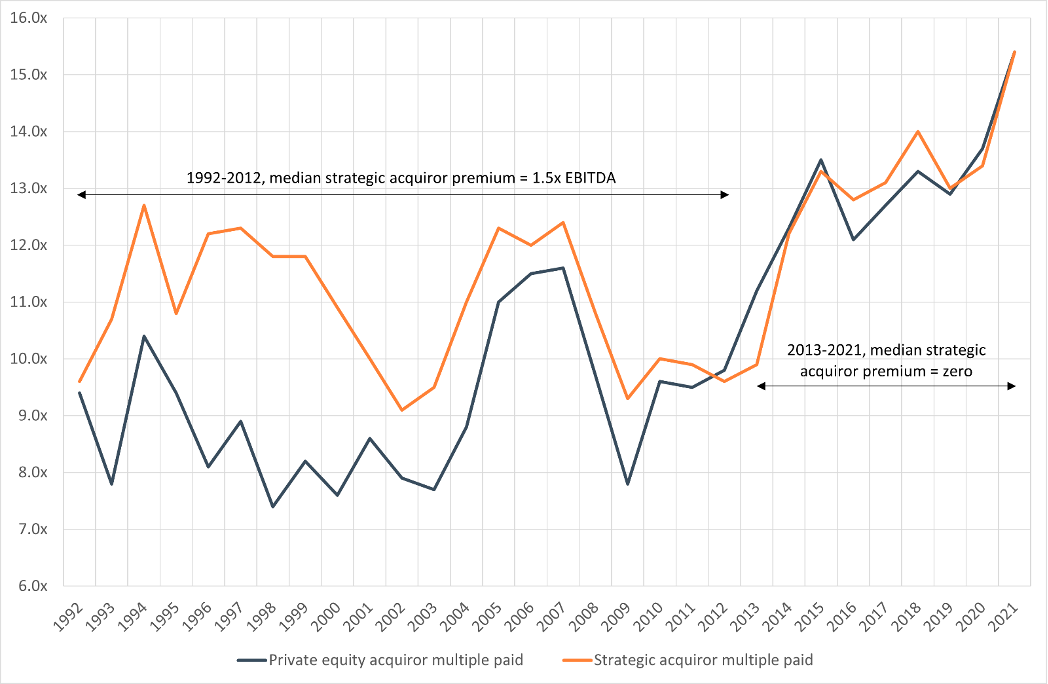
Source: Refinitiv, Sterling analysis
What is at once obvious from this data visualisation is that for most of the period (from 1992-2012, or 21 years) strategic acquirors paid higher valuation multiples for acquisitions than financial sponsors. The median “premium” paid by strategic acquirors vs. private equity from 1992-2012 was around 1.5x EBITDA. What is also striking is that the strategic acquiror premium sharply disappeared in 2013 (the first year that financial sponsors, in aggregate, paid higher multiples than strategics). In fact, over the period 2013-2021 the median strategic acquiror premium vs. private equity was zero.
How can we explain these results? One plausible explanation for the ability for strategic acquirors to effectively “outbid” financial sponsors (the situation during 1992-2012) is that strategics should have more opportunities to realise operational synergies from their acquisitions (that is after all the typical rationale for most corporate dealmaking) – duplicate costs can be eliminated, the combined entity may have greater bargaining power with suppliers, there may be opportunities for revenue-enhancing synergies such as cross-selling or price increases, etc. Greater synergies means that targets should, all other things being equal, be more highly valued by strategic acquirors who are therefore able to pay a higher price.
Financial sponsors, on the other hand, are usually considered to have more limited options for synergy generation, not having a large existing business to combine with the target, being more heavily reliant on higher levels of debt or leverage (often termed “financial engineering”) to generate attractive returns from acquisitions. Hence, private equity is much more sensitive to levels of interest rates and financial covenants such as debt/EBITDA that limit how much debt can form part of the capital structure of the acquisition and hence how much equity can be contributed while still generating the required levels of returns for the equity owners (the investors in the private equity funds).
I would argue that these explanations have been weakened by two major shifts in the tectonic plates of finance and M&A during the past decade, shifts that are directly responsible for the result that we see from 2013 onwards. Competition between private equity and strategic acquirors for deals has intensified such that private equity is able to pay the same (or higher) valuation multiples for acquisitions than strategics, while at the same time ensuring that these multiples have inexorably ground higher. The first shift - monetary policy - is usually thought of as cyclical, while the second shift - the rise of the private equity “conglomerate” - is structural.
The first shift, and the catalyst for the breakdown in the strategic acquiror premium, was the coordinated policy by the world's central banks of cutting interest rates to historically low levels, first as a reaction to the 2007/08 financial crisis and then again as the response to the coronavirus pandemic. As I discussed in part 1, record low interest rates had the effect of lowering the global cost of capital, reducing discount rates for risk assets (thereby increasing valuations) and making cheap-debt-financed acquisitions more attractive - perfect conditions for private equity. Private equity has been steadily increasing its share of worldwide M&A since 2009, with its share accelerating in the past 3-4 years: private equity acquirors accounted for 34% of all M&A deals in 2021 compared to less than 20% in 2017 and less than 3% thirty years ago.
The second shift has been the phenomenal growth in the financial sponsor industry over the past thirty years. Three decades of relentless fundraising and dealmaking has created a universe of private equity firms which own over 55,000 active portfolio companies. Within this universe there is a new breed of financial sponsor, with dozens or even hundreds of portfolio companies held across multiple funds. The largest buyout investors, such as Kohlberg Kravis Roberts and Blackstone, each own over four hundred companies. The top seventy private equity firms each own over one hundred companies. If aggregated across all of their companies held this would place the top financial sponsors among the largest private-sector employers in the world, creating what I have called the “new conglomerates”.
The result of all this dealmaking means that private equity firms are now in a position of being able to realise significant operational synergies from their acquisitions – similar to those available to even very large strategic acquirors. This growing ability to extract operational synergies, coupled with the extremely accommodative financing environment as a result of worldwide ultra-loose monetary policy, has driven the ability of financial sponsors to compete ferociously with strategic acquirors for deals, closing the valuation gap that previously existed and also driving valuation multiples to record highs.
I’m going to finish with a look at which target sectors have been the subject of the most competition between private equity and strategics for deals in 2021. In the chart below, I have placed an asterisk against those sectors where the median valuation multiple paid by financial sponsors was higher than that paid by strategic acquirors. As can be seen, private equity outbid strategics in five of the eleven target sectors, with no difference in the median multiple paid across all deals - 15.4x.
Worldwide median target EV/EBITDA multiples paid in 2021 by target sector, private equity vs. strategic acquiror
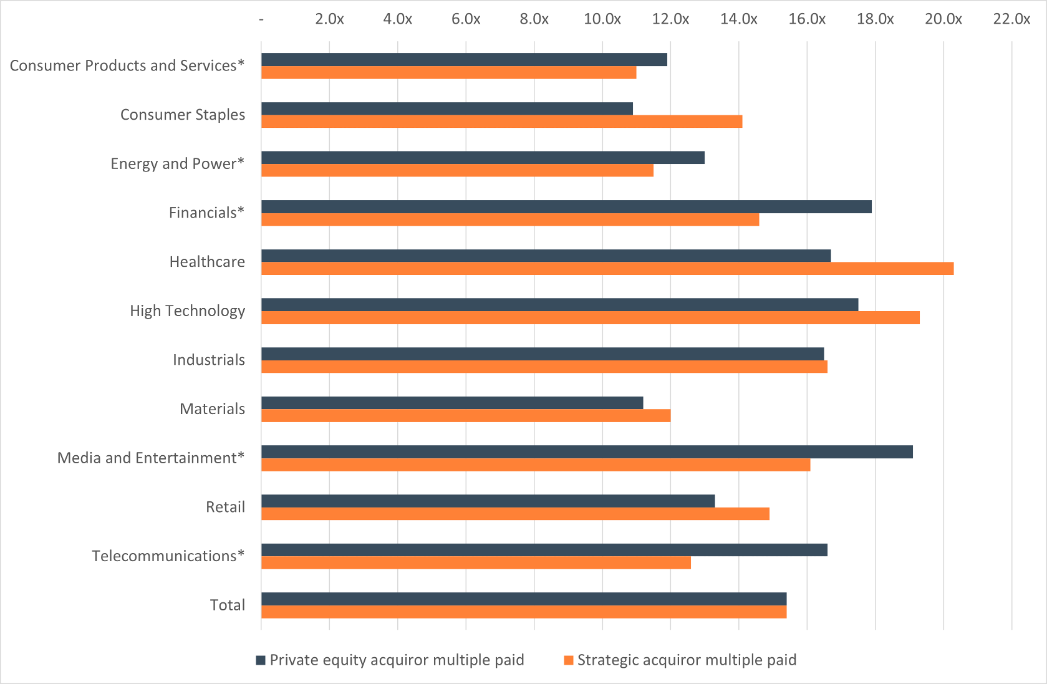
Source: Refinitiv, Sterling analysis
If you are a strategic acquiror then private equity is coming to eat your lunch - or to eat you. How can corporate bidders respond to these conditions? One way is to place an even greater emphasis on synergy evaluation as well as a well-planned, well-executed and rapid post-merger integration process. Experienced, serial acquirors know that the key to realising the hoped-for revenue and cost synergies, strategic fit, cultural integration, and increased shareholder value that underpinned the deal rationale depends on a successful PMI. Sterling recently penned a guide to maximising deal success through PMI, which can be read here[2].
With over $2.5 trillion of private capital dry powder available to be spent on acquisitions, expect financial sponsors to continue to make life difficult for strategic acquirors with inorganic growth plans in 2022.
For more information on how Sterling Technology can help make your next deal a great deal better, please complete the form below or contact us.
[1] Target enterprise value divided by target earnings before interest, tax, depreciation, and amortisation.
[2] https://www.sterlingvdr.com/guides/technology-tools-to-maximise-post-merger-integration-success
Philip Whitchelo is Sterling's chief strategy & marketing officer.


